
Key takeaways
- Market microstructure studies how trading rules and participant behaviour turn orders into prices, spreads and liquidity.
- The bid-ask spread compensates liquidity providers for three costs: order processing, inventory risk and adverse selection.
- Classic models — Roll (1984), Kyle (1985), Glosten-Milgrom (1985), Amihud (2002), Avellaneda-Stoikov (2008) — still explain spreads, price impact and quoting behaviour.
- Market design choices — tick size, priority rules, fee models, auctions and speed bumps — change who provides liquidity and at what cost.
- Desks measure microstructure through effective and realized spreads, price impact, depth, markouts, fill rates and implementation shortfall.
- 2025–2026 brought major structural change: the EU consolidated tape, US Rule 605 and tick-size reforms, 24x5 clearing and the move toward overnight trading.
What is market microstructure?
Market microstructure is the study of how trading actually happens — the venue rules, order types and participant behaviour that turn individual orders into prices, spreads and liquidity. Where asset pricing asks what something is worth, microstructure asks how the market discovers that value and what it costs to trade on the way.
Maureen O’Hara’s classic definition describes the field as the study of the process and outcomes of exchanging assets under explicit trading rules. The term itself is usually traced to Mark Garman’s 1976 paper “Market Microstructure”, which modelled how a dealer sets prices when buy and sell orders arrive at random.
For a trading desk, microstructure is not academic. It explains why the same order costs more at 9:31 than at 11:00, why a passive order fills on one venue but not another, and why a liquidity provider loses money on fills that look profitable when they happen.
Who trades: the participants in a modern market
Every market brings together participants with different goals and information: liquidity providers who quote both sides, institutional investors executing large orders, retail traders, arbitrageurs who link venues, brokers who route orders and venues that set the rules. Microstructure studies how their interaction sets prices and costs.
| Participant | Main goal | Typical behaviour |
|---|---|---|
| Market makers and HFT liquidity providers | Earn the spread while limiting inventory risk | Quote both sides, update constantly — see our HFT guide |
| Institutional investors | Execute large orders at low cost | Split orders over time with algorithms, use dark pools and auctions |
| Retail traders | Convenient, low-cost execution | Small market orders, often routed to wholesalers |
| Arbitrageurs | Profit from price differences | Trade across venues and related instruments |
| Brokers | Route client orders, meet best-execution duties | Smart order routing, algorithm provision |
| Venues | Attract volume and fees | Set matching rules, order types and fee schedules |
The key distinction is between informed and uninformed traders. Liquidity providers cannot see who is who, so they price the risk of meeting an informed trader into every quote. Most of microstructure theory follows from that one problem.
The limit order book: the building block of electronic markets
Most modern markets run a continuous limit order book: a ranked list of resting buy and sell orders. Orders are sorted by price and then by a priority rule, usually time. A trade happens when an incoming order crosses the spread and matches against resting liquidity on the other side.
Orders, queues and priority
Two order types do most of the work:
- Limit orders rest in the book at a chosen price and provide liquidity.
- Marketable orders (market orders or aggressive limit orders) take liquidity immediately.
When several orders rest at the same price, a priority rule decides who fills first. Price-time priority (FIFO) rewards the earliest order and dominates equities and most FX venues. Pro-rata allocation splits fills by order size and is common in some interest-rate futures. The rule matters: under FIFO, queue position has real economic value, which drives investment in speed.
A simple order book
| Bid size | Bid | Ask | Ask size |
|---|---|---|---|
| 300 | 100.02 | 100.03 | 200 |
| 800 | 100.01 | 100.04 | 600 |
| 1,500 | 100.00 | 100.05 | 1,200 |
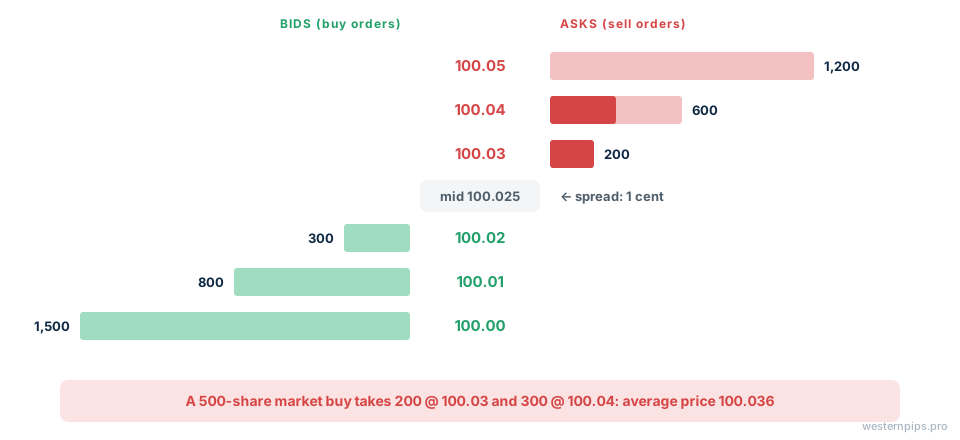
In this book the quoted spread is one cent and the midpoint is 100.025. A market buy order for 500 shares takes 200 at 100.03 and 300 at 100.04, paying an average of 100.036. That “walk up the book” is the most basic form of price impact.
Figure 1: Depth of the example order book
Order types beyond limit and market
- Immediate-or-cancel (IOC) and fill-or-kill (FOK): take available liquidity now and cancel the rest.
- Post-only: rests in the book but is rejected if it would trade immediately, guaranteeing maker status.
- Hidden and iceberg orders: show none or only part of their size, at the cost of lower priority.
- Pegged and midpoint orders: float with the best bid, offer or midpoint.
- Auction orders: participate only in opening, closing or intraday auctions.
Depth, spread and resiliency
Three properties describe a book’s liquidity:
| Dimension | What it measures | Why traders care |
|---|---|---|
| Tightness | Width of the bid-ask spread | Cost of a small round trip |
| Depth | Volume available near the best prices | How large an order can trade before moving the price |
| Resiliency | How fast the book refills after a large trade | Cost of splitting a big order over time |
A market can be tight but shallow, or deep but slow to recover. Execution strategies that ignore any of the three tend to underestimate costs.
Why the bid-ask spread exists
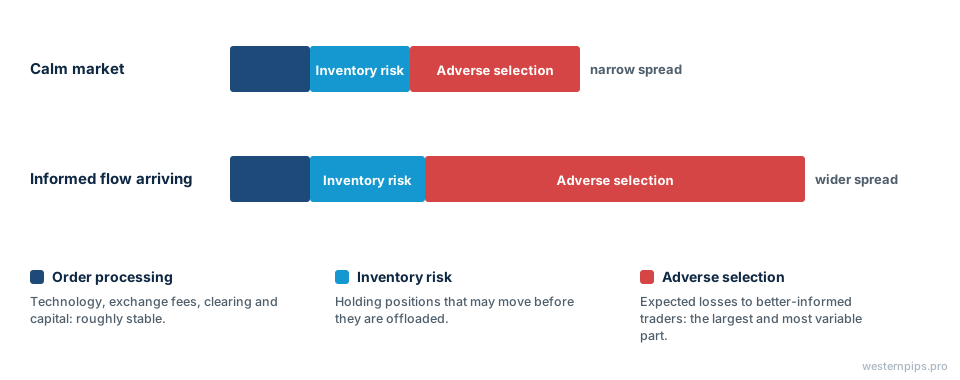
The spread compensates liquidity providers for three costs: processing orders, holding inventory and trading against better-informed counterparties. In fast electronic markets, adverse selection — losing to informed traders — is usually the largest component, which is why spreads widen when information is arriving.
The three-part decomposition is one of the field’s most useful ideas:
- Order processing costs — technology, exchange fees, clearing and capital.
- Inventory costs — the risk of holding a position that moves against you before it can be offloaded.
- Adverse selection costs — expected losses to traders who know something the market maker does not.
The intuition is simple. If one in ten buyers knows the price is about to rise by ten cents, a market maker loses a cent per trade on average to that group. It must charge every buyer at least that much extra to break even — so uninformed traders pay for the presence of informed ones.
Figure 2: What the bid-ask spread pays for
Key microstructure models and formulas
A handful of models form the core toolkit. Roll infers the spread from price changes, Kyle measures price impact per unit of order flow, Glosten-Milgrom explains spreads through adverse selection, Amihud gives a simple illiquidity ratio, and Avellaneda-Stoikov shows how market makers skew quotes to control inventory.
| Model | Core idea | Practical use |
|---|---|---|
| Roll (1984) | Spread = 2 × √(−Cov(ΔPₜ, ΔPₜ₋₁)) | Estimate spreads when only trade prices are available |
| Glosten–Milgrom (1985) | Ask = expected value given a buy; bid = expected value given a sell | Why spreads widen with more informed traders |
| Kyle (1985) | ΔP = λ × net order flow | Kyle’s lambda as a measure of price impact and illiquidity |
| Easley–O’Hara PIN (1990s) | Probability that a trade comes from an informed trader | Measuring information asymmetry; VPIN is a later, volume-based variant |
| Amihud (2002) | Illiquidity = average of |return| ÷ dollar volume | Simple cross-asset illiquidity ranking from daily data |
| Almgren–Chriss (2000) | Trade off market impact against price risk when splitting an order | Foundation of optimal execution algorithms |
| Avellaneda–Stoikov (2008) | Market maker shifts quotes away from its inventory and widens with volatility | Quoting logic in market-making systems |
The square-root law of impact
Across equities, futures and other markets, empirical studies find that the price impact of a large metaorder grows roughly with the square root of its size: impact ≈ Y × σ × √(Q / V), where σ is daily volatility, Q is order size, V is daily volume and Y is a constant close to one. Doubling an order increases impact by about 40%, not 100%. The rule is approximate, but most pre-trade cost models used by brokers are built around it.
Price discovery and order flow
Price discovery is how new information gets into prices. It happens through order flow: informed traders buy or sell, liquidity providers update quotes in response, and prices move toward a new consensus. Measuring which venue or instrument moves first tells you where price discovery happens.
Not every market discovers prices equally. In US equities, index futures in Chicago often lead the cash market in New Jersey by milliseconds. In FX, primary interbank venues and large non-bank liquidity providers lead aggregated retail streams. Academic measures such as information share quantify each venue’s contribution.
For practitioners, order flow carries the signal. Signed volume, order book imbalance and the toxicity of incoming flow are the inputs most short-term models use. When a fast trader acts on a price change before slower quotes update, the result is a latency arbitrage race — the clearest example of adverse selection in modern markets.
Market design: the rules that shape liquidity
Venue rules change outcomes. Tick size sets the minimum spread and the value of queue position; fee models decide who pays for liquidity; auctions concentrate volume at key moments; and speed bumps or periodic auctions reduce the value of pure speed. Each design favours different participants.
- Tick size. A large tick relative to price creates long queues and makes queue position valuable; a small tick lets spreads narrow but fragments depth across more price levels. The US half-penny tick for tightly spread stocks, due in November 2026, is a live example.
- Fee models. Maker-taker venues pay rebates to liquidity providers and charge takers; inverted venues do the opposite, attracting passive orders that want queue priority. US access-fee caps limit how far this can go.
- Auctions. Opening and closing auctions concentrate liquidity at one price. Closing auctions have grown as passive funds trade at the close, making them a major part of daily volume.
- Continuous versus periodic matching. Frequent or periodic auctions match orders at discrete moments, reducing the payoff to being a few microseconds faster.
- Speed bumps. Fixed delays, such as the 350-microsecond delay at IEX, give liquidity providers time to update stale quotes.
- Market-wide safeguards. Circuit breakers, limit up-limit down bands and volatility interruptions pause trading when prices move too far, too fast.
Fragmentation: lit, dark and internalised liquidity
Most large markets are fragmented across many venues. US equities trade on more than a dozen exchanges, dozens of alternative trading systems and wholesale internalisers. Fragmentation increases competition between venues but splits liquidity, creating routing problems and opportunities for cross-venue arbitrage.
Fragmentation was a deliberate policy outcome. Regulation NMS in the US (2005) and MiFID in Europe (2007, revised as MiFID II in 2018) encouraged competition between exchanges and alternative venues. The result:
- Lit exchanges display quotes and run continuous order books.
- Dark pools match orders without pre-trade transparency, usually at the lit midpoint.
- Internalisers and wholesalers execute client orders against their own capital, a model linked to payment for order flow.
Smart order routers stitch this landscape together, and consolidated data — the US SIP and, since September 2026, the EU consolidated tape — tries to give everyone a single view of it. Firms that need the fastest view use direct market data feeds instead, which is itself a microstructure issue: participants see the same market at different times.
Microstructure across asset classes
The same principles apply everywhere, but the mechanics differ. Equities and futures are exchange-centric with central order books; spot FX is a fragmented OTC market built on streamed quotes; crypto trades 24/7 across centralised exchanges and on-chain venues with very different rules.
| Asset class | Main trading model | Distinctive microstructure feature |
|---|---|---|
| Equities | Exchanges, ATSs, internalisers | Fragmentation, NBBO, tick-size rules |
| Futures | Central exchange order book | Single venue per contract, pro-rata in some products |
| Spot FX | OTC, streamed quotes, ECNs | Last look, no consolidated tape — see our FX liquidity guide |
| Fixed income | RFQ, dealer-to-client and electronic venues | Episodic liquidity, growing electronification |
| Crypto | CEX order books, AMMs, on-chain CLOBs | 24/7 trading, funding rates, MEV |
Key microstructure metrics every desk should monitor
The core metrics are quoted, effective and realized spreads; price impact; depth at the touch and beyond; fill and reject rates; and markouts — the move in the market after each fill. Together they separate the cost of crossing the spread from the cost of trading against informed flow.
- Quoted spread: best offer minus best bid.
- Effective spread: twice the distance between the trade price and the midpoint at the time of the trade — what a taker actually paid.
- Realized spread: the effective spread measured against the midpoint a few seconds later — what the liquidity provider kept.
- Price impact: effective minus realized spread — the part lost to information.
- Markouts: P&L of each fill at fixed horizons (milliseconds for HFT, minutes for institutional orders).
- Fill rate and reject rate: essential in FX and on venues with last look or speed bumps.
A worked example
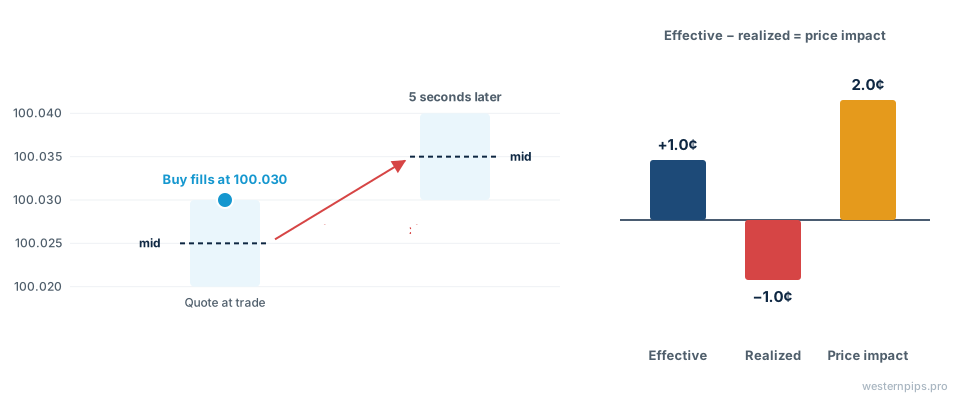
A buyer pays 100.03 when the midpoint is 100.025. Five seconds later, the midpoint is 100.035.
| Metric | Calculation | Result |
|---|---|---|
| Quoted spread | 100.03 − 100.02 | 1.0 cent |
| Effective spread | 2 × (100.03 − 100.025) | 1.0 cent |
| Realized spread (5 s) | 2 × (100.03 − 100.035) | −1.0 cent |
| Price impact | Effective − realized | 2.0 cents |
The liquidity provider who sold at 100.03 earned the spread on paper but lost money five seconds later: the trade was informed. Repeated across thousands of fills, this is how adverse selection shows up in the numbers.
Figure 3: Effective spread, realized spread and price impact
Transaction cost analysis: microstructure for the buy side
For institutional investors, microstructure shows up as transaction costs. Transaction cost analysis compares execution prices with benchmarks such as arrival price, VWAP and the close. Implementation shortfall — the gap between the decision price and the final average price, including unfilled shares — is the most complete measure.
| Benchmark | What it measures | Weakness |
|---|---|---|
| Arrival price (implementation shortfall) | Total cost from the moment the order reached the desk | Noisy for small samples |
| VWAP | Execution versus the day’s volume-weighted price | Can be gamed by trading with the volume |
| Closing price | Cost relative to the closing auction | Suits index funds, not alpha-driven orders |
| Markouts after fills | Information leakage and venue toxicity | Requires high-quality timestamps |
Implementation shortfall, introduced by André Perold in 1988, splits cost into delay, market impact, timing and opportunity cost from shares that never filled. Modern execution algorithms try to minimise it by balancing urgency against impact, following the Almgren–Chriss logic above.
When microstructure breaks: lessons from market stress
Stress events show how liquidity can vanish in seconds. The 2010 Flash Crash, the October 2014 US Treasury flash rally and the August 2015 ETF dislocations all involved liquidity providers withdrawing, order books thinning and prices overshooting before recovering. Each led to new safeguards.
- 6 May 2010, Flash Crash. US equity indices fell sharply and recovered within minutes; some stocks traded at a penny. Regulators introduced single-stock circuit breakers, later replaced by limit up-limit down bands.
- 15 October 2014, Treasury flash rally. Yields on US Treasuries swung sharply within minutes without clear news, prompting a joint official report on the changing structure of the Treasury market.
- 24 August 2015, ETF dislocations. Many ETFs traded far below the value of their holdings at the open as trading halts disrupted arbitrage, leading to changes in opening procedures and halt rules.
The common thread is that liquidity in electronic markets is supplied voluntarily. When uncertainty spikes, adverse selection risk rises, liquidity providers widen or withdraw, and depth disappears just when it is needed.
What changed in market structure in 2025–2026
The last two years brought the biggest structural changes in a decade: the EU consolidated tape went live in September 2026, US Rule 605 execution-quality reporting expanded, Reg NMS tick-size and fee reforms moved toward compliance, DTCC began clearing on a 24x5 schedule and exchanges prepared overnight sessions.
- EU consolidated tape. ESMA authorised EuroCTP as the consolidated tape provider for shares and ETFs in July 2026, and the tape began distribution in September 2026, including a European best bid and offer.
- Rule 605. The SEC’s expanded execution-quality disclosure rules for US equities reached their compliance date of 1 August 2026 after an extension from December 2025.
- Tick sizes and access fees. Reg NMS amendments introduce half-penny ticks for tightly spread stocks and lower access-fee caps; compliance was pushed from November 2025 to November 2026.
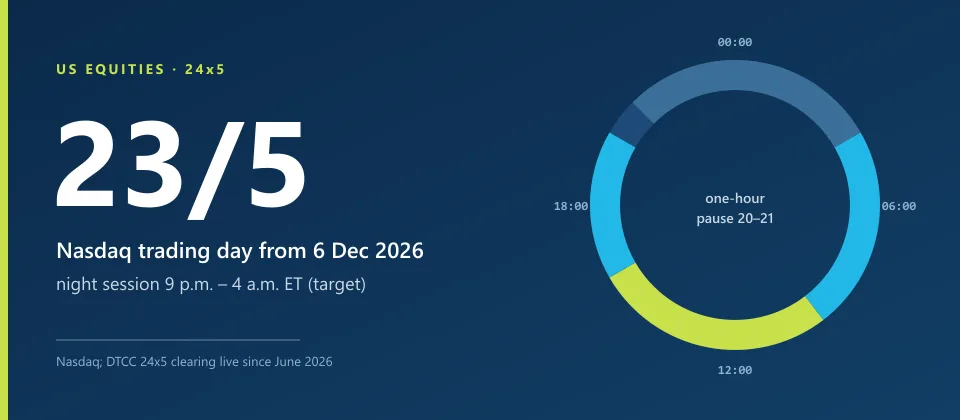
- 24x5 equities. DTCC’s NSCC moved to 24x5 clearing in June 2026, and Nasdaq targeted December 2026 for a 23-hour trading day. Our 24-hour trading analysis covers the details.
- EU PFOF ban. Germany’s transitional exemption expired at the end of June 2026, completing the EU-wide ban on payment for order flow.
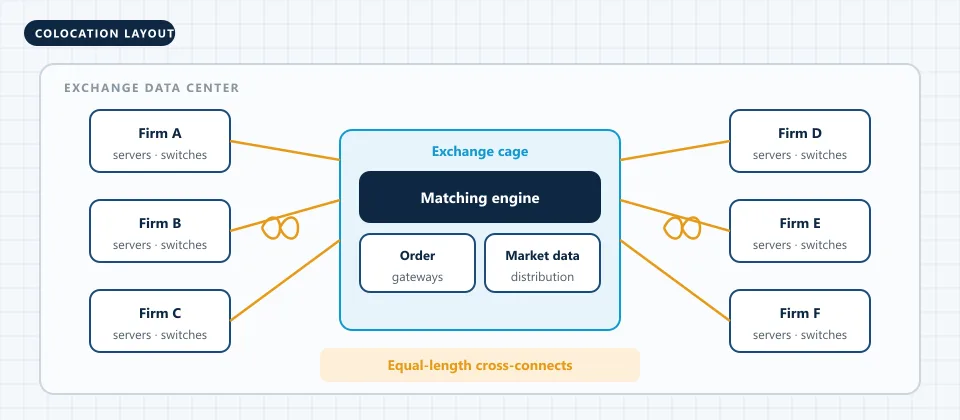
- Exchange cloud migration. CME Group’s move to Google Cloud, with Aurora colocation targeted for late 2027, will change how latency and access are engineered — see our colocation guide.
How to study microstructure as a practitioner
Start with the classic texts, then work with real data. Larry Harris’s Trading and Exchanges, Maureen O’Hara’s Market Microstructure Theory and Joel Hasbrouck’s Empirical Market Microstructure cover the theory; reconstructing an order book from exchange data teaches more than any textbook.
A practical learning path:
- Read Harris for intuition, O’Hara for models, Hasbrouck for empirical methods.
- Download a day of order-by-order data (for example Nasdaq ITCH sample files) and rebuild the book.
- Compute spreads, depth and markouts for a liquid and an illiquid stock and compare them.
- Estimate Roll’s spread and Kyle’s lambda from the same data and compare them with the measured values.
- Read the venue rulebooks for the markets you trade — matching rules, order types and fee schedules are microstructure in practice.
Frequently asked questions
What is market microstructure in simple terms?
Market microstructure is the study of how trading actually happens: the rules of each venue, the types of orders traders use and the behaviour of participants. It explains how orders become prices, why spreads exist and what determines the real cost of a trade.
Who coined the term market microstructure?
The term is usually credited to Mark Garman, whose 1976 paper titled “Market Microstructure” modelled how dealers set prices. Maureen O'Hara’s 1995 book Market Microstructure Theory later became the field’s standard reference.
Why does market microstructure matter for traders?
Because execution costs are often larger than commissions. Understanding spreads, depth, price impact and adverse selection helps traders choose order types, venues and timing, and helps liquidity providers price risk correctly.
What are the three components of the bid-ask spread?
Order processing costs (the cost of running the business), inventory holding costs (the risk of holding positions) and adverse selection costs (losses to better-informed traders). In fast electronic markets, adverse selection is usually the largest component.
What is the difference between quoted, effective and realized spread?
The quoted spread is the displayed difference between best bid and offer. The effective spread measures what a trade actually paid relative to the midpoint. The realized spread measures what the liquidity provider kept after the price moved, a few seconds later.
What is Kyle’s lambda?
Kyle’s lambda is a measure of price impact: how much the price moves per unit of net order flow. It comes from Albert Kyle’s 1985 model of an informed trader. A high lambda means the market is illiquid and large orders move prices a lot.
What is the square-root law of market impact?
It is an empirical regularity that the price impact of a large order grows roughly with the square root of its size relative to daily volume, scaled by volatility. Doubling an order’s size increases its impact by about 40%, not 100%.
Sources and further reading
- Market Microstructure Theory — Maureen O'Hara, Blackwell, 1995
- A Simple Implicit Measure of the Effective Bid-Ask Spread in an Efficient Market (Journal of Finance 39(4)) — Richard Roll, 1984
- Continuous Auctions and Insider Trading (Econometrica 53(6)) — Albert S. Kyle, 1985
- Bid, ask and transaction prices in a specialist market with heterogeneously informed traders (JFE 14(1)) — Lawrence Glosten and Paul Milgrom, 1985
- Illiquidity and stock returns: cross-section and time-series effects (Journal of Financial Markets 5(1)) — Yakov Amihud, 2002
- High-frequency trading in a limit order book (Quantitative Finance 8(3)) — Marco Avellaneda and Sasha Stoikov, 2008
- ESMA authorises EuroCTP as the Consolidated Tape Provider for shares and ETFs — European Securities and Markets Authority, 2026
- Federal Register notice on Rule 605 exemptions and compliance date — U.S. Securities and Exchange Commission, 2026
- SEC adopts amendments to Regulation NMS (tick sizes, access fees, market data) — U.S. Securities and Exchange Commission, 2024

Svetlana Berezhnova is a co-founder of Westernpips and has been a trader since 2007. She has been with the company from its very beginning and is an expert in high-frequency trading and latency-sensitive trading software.
This article is for educational purposes and describes market structure; it is not investment, legal or tax advice. Statistics are attributed to their original sources, which should be consulted for methodology and limitations.