
Key takeaways
- Market makers earn the bid-ask spread by buying at the bid and selling at the offer, repeated across huge volumes.
- Exchange rebates, internalisation and payment-for-order-flow arrangements add revenue; fees, hedging and technology subtract it.
- Their main costs are adverse selection — trading against informed or faster counterparties — and inventory risk from positions they cannot offload.
- Quoting models from Glosten-Milgrom to Avellaneda-Stoikov formalise how to set spreads and skew quotes against inventory.
- Electronic market makers reported record trading revenues in 2025, but profits are concentrated among firms with scale, technology and risk discipline.
What does a market maker do?
A market maker continuously quotes a price to buy (the bid) and a price to sell (the offer) and stands ready to trade at both. By doing so it supplies liquidity: buyers and sellers can trade immediately without waiting for each other. In return, the market maker earns the spread — and takes on the risks of holding positions.
Market makers operate on exchanges, often under formal obligations to quote within certain spreads and sizes, and in OTC markets such as FX and bonds, where they stream prices to clients. Modern market making is overwhelmingly electronic: algorithms update thousands of quotes per second across instruments and venues.
Spread capture: the core revenue
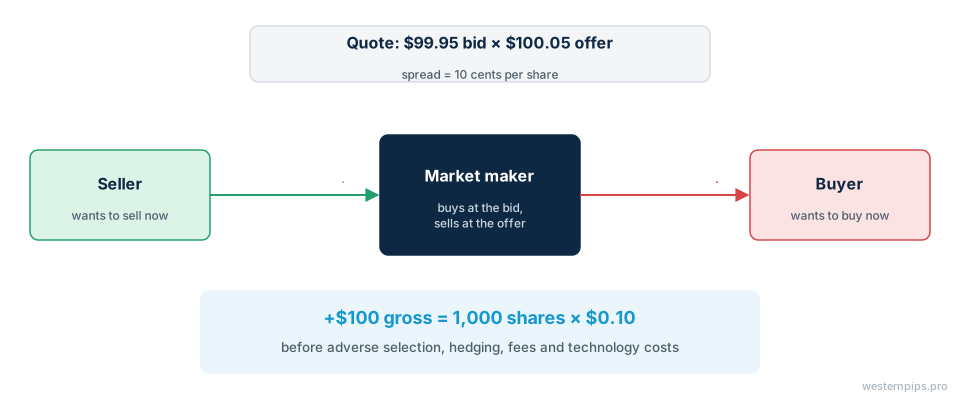
Market makers earn money by buying at the bid and selling at the offer. If a stock is quoted $99.95 bid and $100.05 offered, the spread is 10 cents per share; a market maker who buys and then sells 1,000 shares captures about $100 before costs. Repeated millions of times, small spreads add up to large revenue.
The arithmetic is simple, but the reality is harder:
- Buyers and sellers rarely arrive in perfect balance, so the market maker accumulates inventory.
- Prices move while inventory is held.
- Some counterparties know more than the market maker does.
The quoted spread is therefore an upper bound on what market makers earn. The realized spread — what they keep after prices move — is the number that matters.
Figure 1: One round trip of spread capture
Additional revenue: rebates, internalisation and order flow
Beyond the spread, market makers earn exchange rebates for providing liquidity, profit from internalising offsetting client orders without touching the market and, in US retail markets, pay for order flow that is cheaper to trade against. Each source depends on market structure rules.
| Revenue source | How it works | Constraint |
|---|---|---|
| Spread capture | Buy at bid, sell at offer | Adverse selection, competition |
| Maker rebates | Exchange pays liquidity providers | US access-fee caps under Reg NMS |
| Internalisation | Match opposite client orders internally | Best-execution obligations |
| Retail order flow | Trade against low-toxicity flow, often via PFOF | Banned in the EU, UK and Canada |
| Liquidity programmes | Exchange incentives for meeting quoting obligations | Must meet quoting standards |
The SEC’s 2024 Reg NMS amendments lower the access-fee cap for most US stocks from 30 mils to 10 mils per share, which also caps maker rebates. Compliance was extended to November 2026.
How market makers lose money: adverse selection
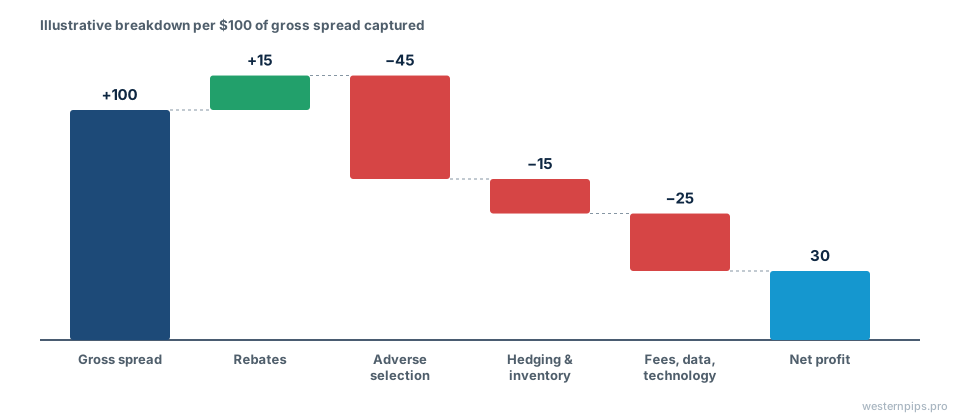
Adverse selection is the biggest cost in electronic market making. When a market maker trades with someone who knows the price is about to move — an informed investor or a faster trader reacting to news — it systematically buys before prices fall and sells before they rise. Spreads exist largely to cover these losses.
The Glosten-Milgrom (1985) model formalises this: a market maker facing a mix of informed and uninformed traders must set a spread wide enough that gains from uninformed traders cover losses to informed ones. The more informed traders there are, the wider the spread.
In practice, adverse selection comes from:
- Information: institutions trading on research or news.
- Speed: latency arbitrageurs picking off quotes before they update — the FCA estimated races account for about a third of the effective spread in UK equities.
- Toxic order flow: segments of flow that consistently precede price moves.
Market makers measure adverse selection with markouts: the profit or loss on each fill a few milliseconds, seconds or minutes later.
Figure 2: From gross spread to net profit
Inventory risk and hedging
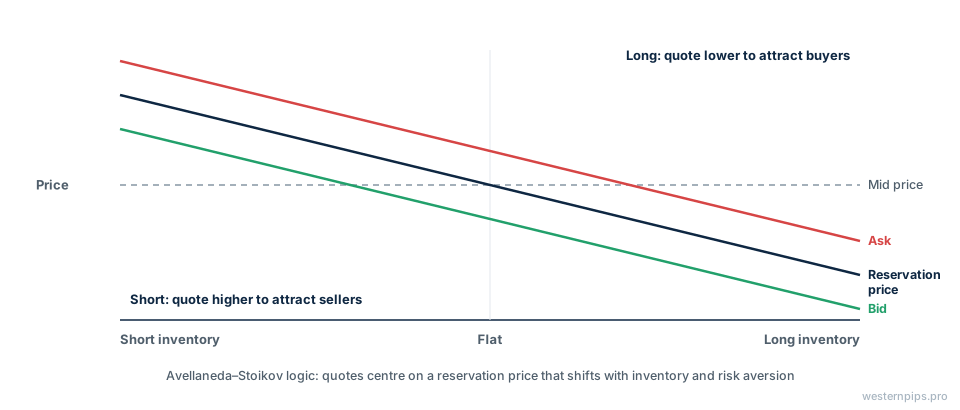
Every fill leaves a market maker with a position. If buy orders dominate, it ends up short; if prices then rise, it loses. Market makers manage this by skewing quotes to attract offsetting orders, hedging with correlated instruments such as futures or ETFs and limiting how much inventory they will hold.
The classic models — Ho and Stoll (1981) and Avellaneda and Stoikov (2008) — show that an inventory-averse market maker should quote around a “reservation price” shifted away from the mid-price in proportion to its inventory and risk aversion. Long inventory means lower quotes to encourage buyers; short inventory means higher quotes.
Common hedging tools:
- Direct hedges in the same instrument on another venue.
- Proxy hedges — index futures for a basket of stocks, or a correlated currency pair.
- Delta hedging for options, adjusting underlying positions as prices move.
Figure 3: Skewing quotes to manage inventory
Market making across asset classes
The economics are similar everywhere, but the mechanics differ. Equity and futures market makers quote on exchanges and compete on speed; options market makers manage volatility and Greeks across thousands of series; FX liquidity providers stream bilateral prices with last look; crypto market makers face 24/7 trading and exchange counterparty risk.
| Market | Key revenue driver | Key risk |
|---|---|---|
| Equities | High volume, tight spreads, rebates | Latency-driven adverse selection |
| Options | Wider spreads, volatility pricing | Gamma and vega exposure, especially in short-dated options |
| Futures | Single-venue depth, queue position | Fast price moves, pro-rata allocation |
| Spot FX | Streaming spreads, internalisation | Toxic flow, last-look controversy |
| Crypto | Volatility, funding, token deals | Exchange and counterparty risk |
The business today: scale and concentration
Electronic market making is a scale business. Reports based on people familiar with the figures put 2025 net trading revenue at a record $39.6 billion for the largest non-bank market maker and around $12 billion each for two other leading firms. Profits concentrate in firms with technology, capital and risk discipline.
What separates profitable market makers:
- Pricing models that estimate fair value faster and more accurately than competitors.
- Low latency to update quotes before they are picked off.
- Risk management that keeps inventory and tail risk under control.
- Breadth across instruments, venues and asset classes to internalise and hedge efficiently.
- Capital and credit to hold inventory through volatile periods.
What market makers mean for other traders
For institutional traders, market makers are both counterparties and competitors. Understanding their economics explains why spreads widen in volatile markets, why large orders move prices and why order type and venue choice matter. Trading in ways that look less toxic — patient, well-routed orders — usually earns better prices.
Practical implications:
- Expect wider spreads around news and at market open, when adverse selection is highest.
- Large aggressive orders reveal information and pay for it through price impact.
- Passive orders earn the spread but risk non-execution and adverse selection themselves.
- Monitoring markouts on your own fills shows how market makers perceive your flow.
Frequently asked questions
How do market makers make money?
Market makers buy at their bid price and sell at their higher offer price, earning the spread on each round trip. They add revenue from exchange rebates and internalising client flow, and they lose money when prices move against their inventory or when they trade with better-informed counterparties.
Do market makers bet against their customers?
Not in the directional sense. A market maker aims to stay roughly flat and profit from volume, not from predicting prices. It takes the other side of trades temporarily and hedges or offsets the risk as quickly as possible.
Is market making risk-free?
No. Market makers face adverse selection (informed traders), inventory risk (positions moving against them), technology failures and liquidity crises. Many firms have suffered large losses during flash events and volatility spikes.
What are maker-taker rebates?
Many exchanges pay a rebate to orders that add liquidity (makers) and charge a fee to orders that remove it (takers). In US equities, access fees are capped by Regulation NMS; the 2024 amendments lower the cap for most stocks, which also limits rebates.
What is the difference between a market maker and a liquidity provider?
The terms overlap. Market maker usually implies continuous two-sided quoting, often with formal obligations on an exchange. Liquidity provider is broader and includes firms that stream prices bilaterally, as in FX, without exchange obligations.
Sources and further reading
- Bid, ask and transaction prices in a specialist market with heterogeneously informed traders — Glosten & Milgrom, Journal of Financial Economics, 1985
- High-frequency trading in a limit order book (Quantitative Finance 8(3)) — Avellaneda & Stoikov, 2008
- SEC adopts amendments to Regulation NMS (access fee caps, tick sizes) — U.S. Securities and Exchange Commission, 2024
- Jane Street, Citadel Securities cement sway with trading hauls — Bloomberg Law, 2026
- Market making explainer — Optiver

Svetlana Berezhnova is a co-founder of Westernpips and has been a trader since 2007. She has been with the company from its very beginning and is an expert in high-frequency trading and latency-sensitive trading software.
This article is for educational purposes and describes market structure; it is not investment, legal or tax advice. Statistics are attributed to their original sources, which should be consulted for methodology and limitations.